When statistics become stories
Presented at DesignUp 2019 in Bangalore, this was a talk primarily given for designers. By walking through different datasets in the Indian context, I broke down some of the concerns and challenges of using statistics in stories.

“If the statistics are boring, then you’ve got the wrong numbers.”
“Finding the right numbers requires as much specialised skill - statistical skill - and hard work as creating a beautiful design or covering a complex news story.”
— Edward Tufte
If you are wondering why I am talking about statistics and data at a design conference, it is because no amount of design can save a bad story.
If there is no story, no matter how fancy it looks and how cool your design is, it is still a bad story. No amount of design can save something with a weak message. However, with the right story, design can elevate it. Just the way, a good story can really elevate your design.
At the end of the day, 90% of my work is analysing and drawing inferences. Only 10% is the communication.
What we choose to count matters. Because it determines the stories we can tell.
Coming back to the Tufte quote…
 So what are those right numbers? I try and explore using multiple datasets in the Indian context.
Dataset No. 1: The Indian Census
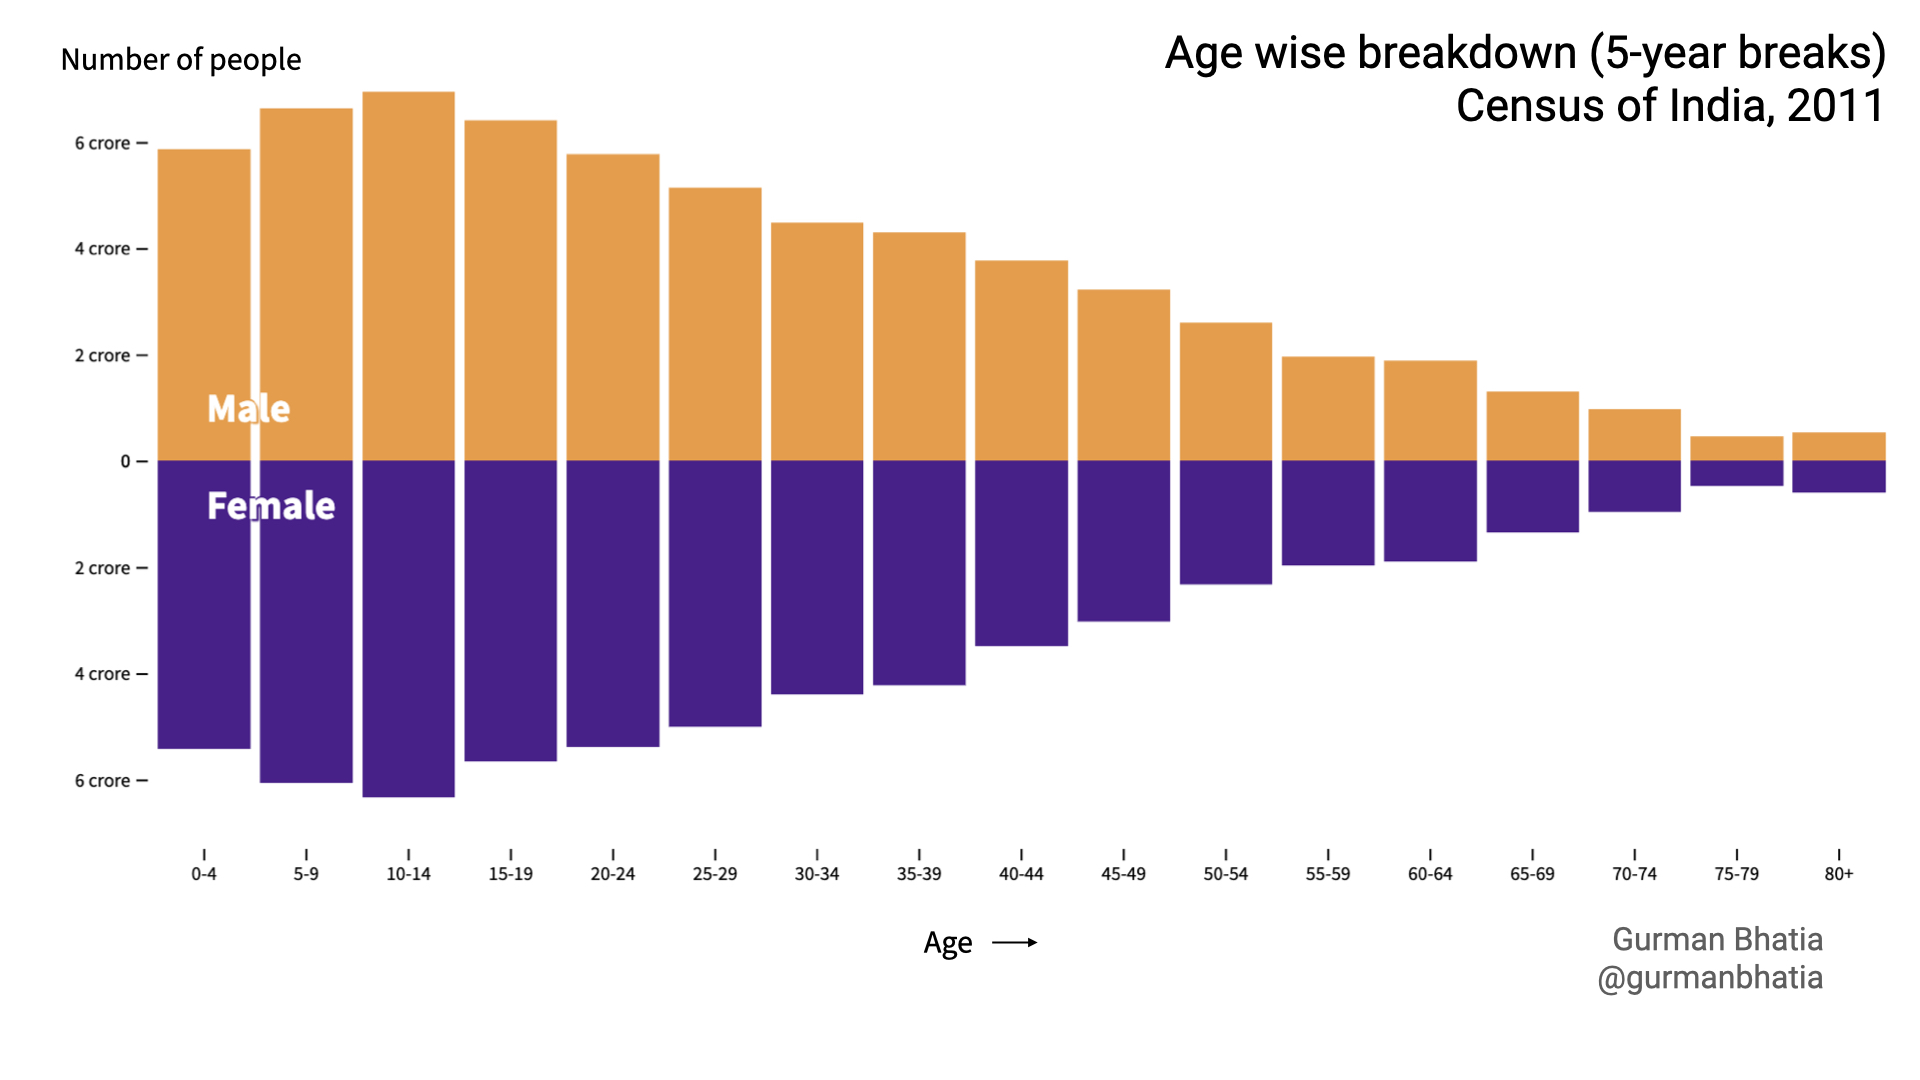
To talk about the Indian census, I am going to talk about a slightly touchy topic - age. If you look at the age-wise breakdown for the last census by 5-year breaks, this is what it looks like.
 You look the same data as 1-year breaks, it looks like this.
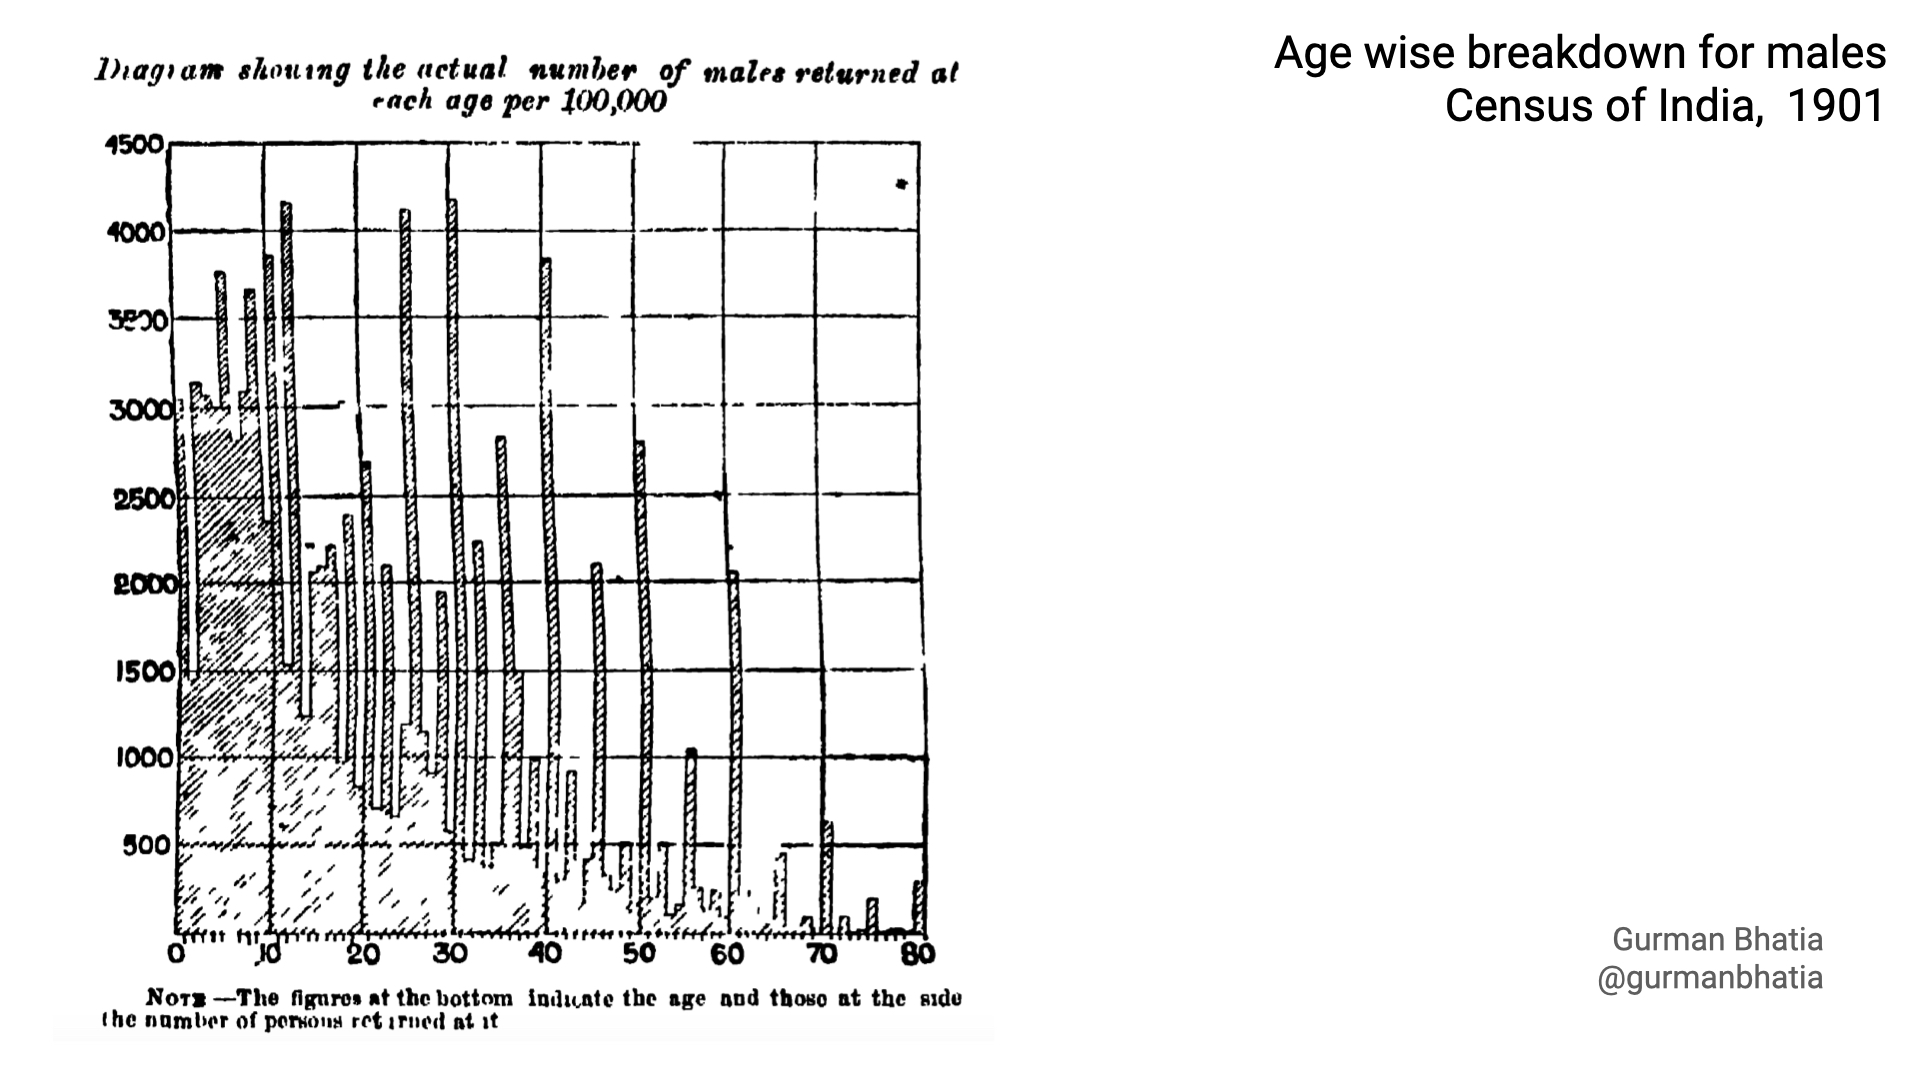
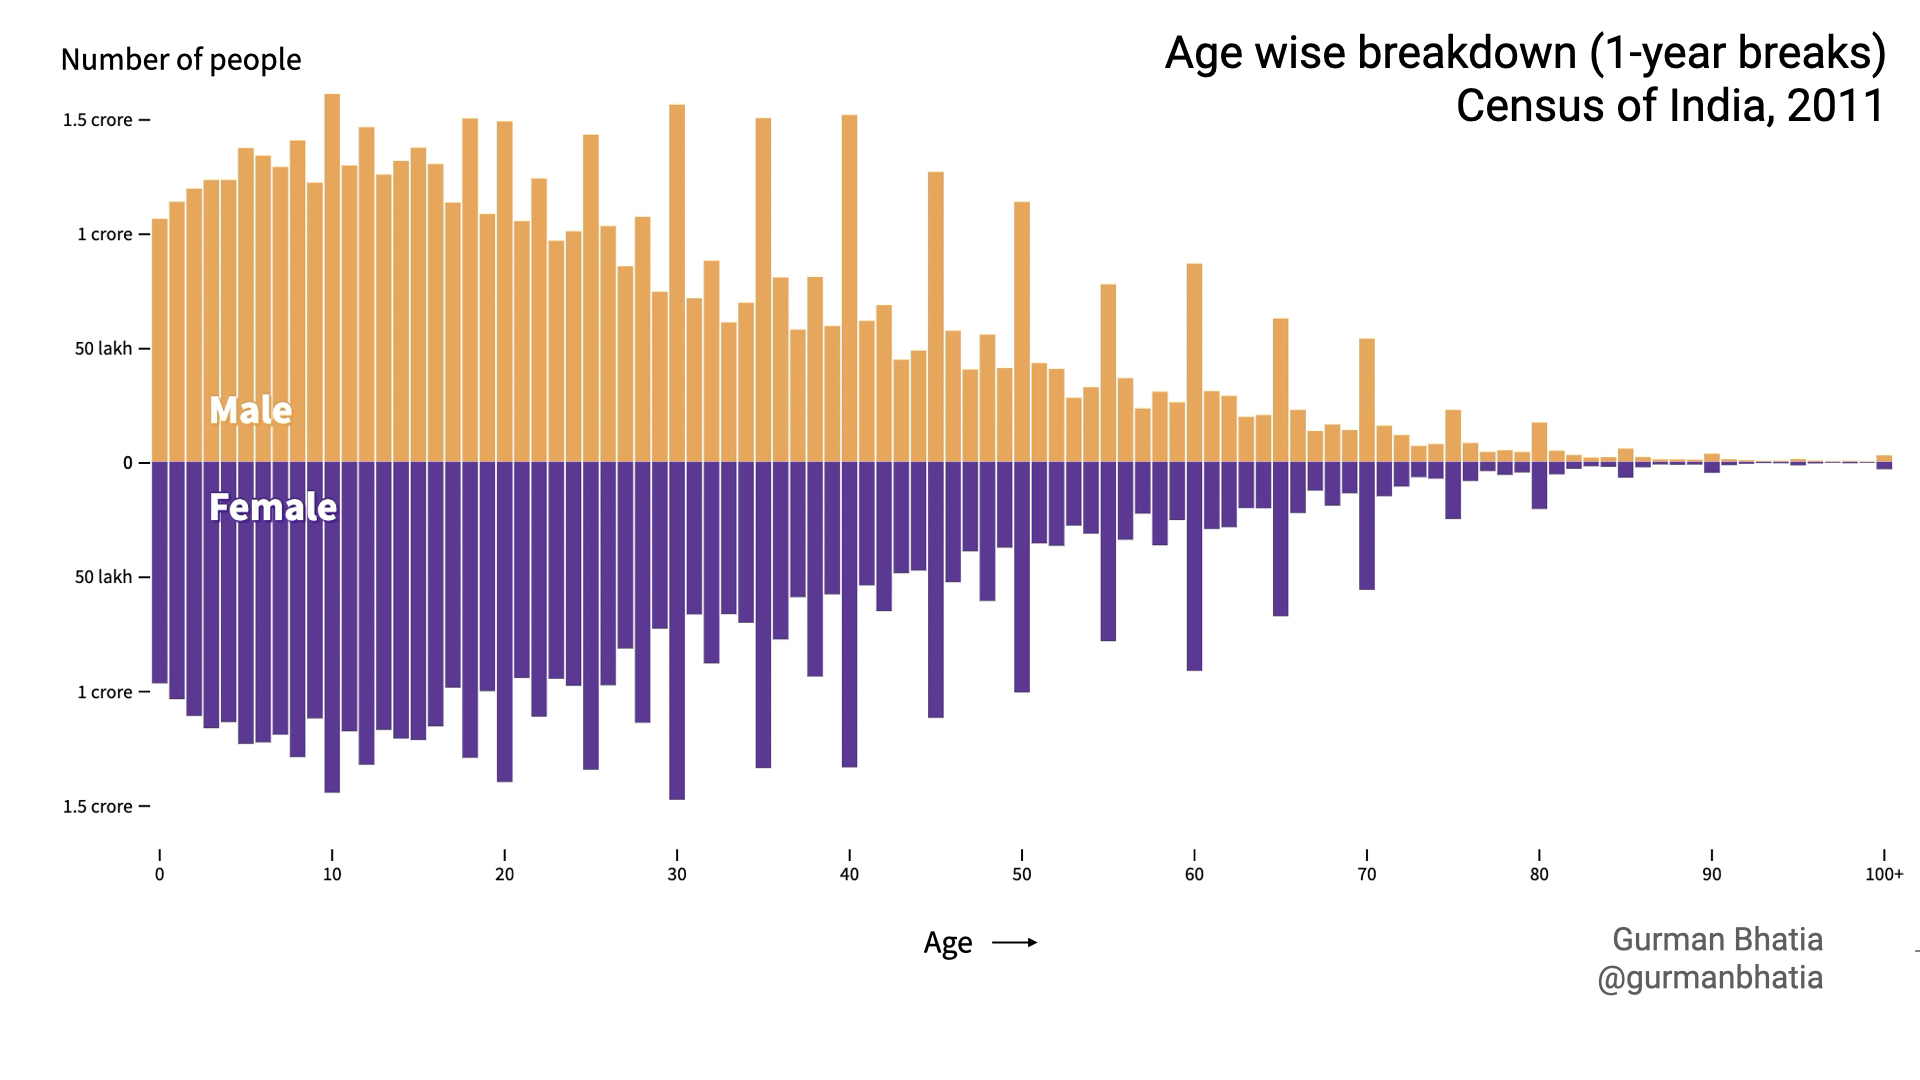 Those spikes that you see on units of 5 and 10 are a consistent phenomenon, something we see in historical census books as well.
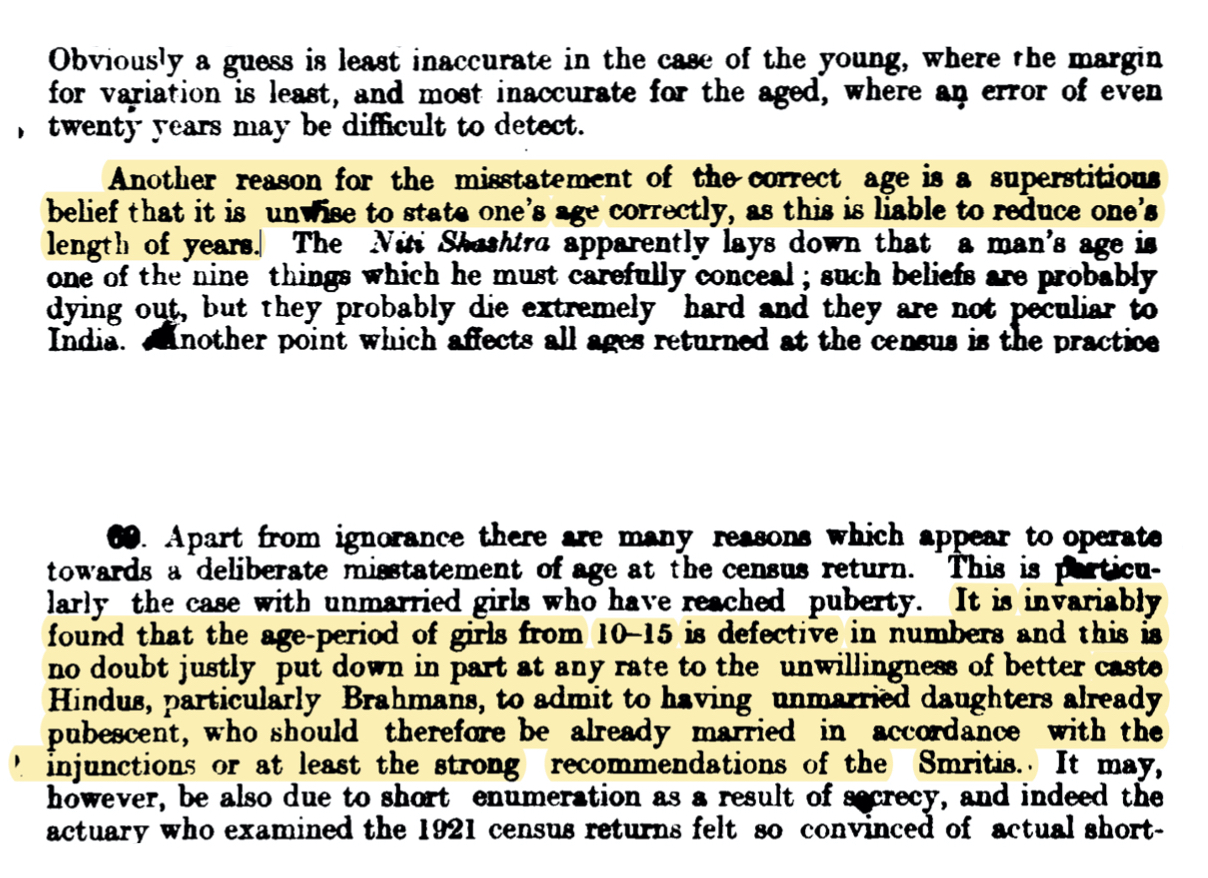
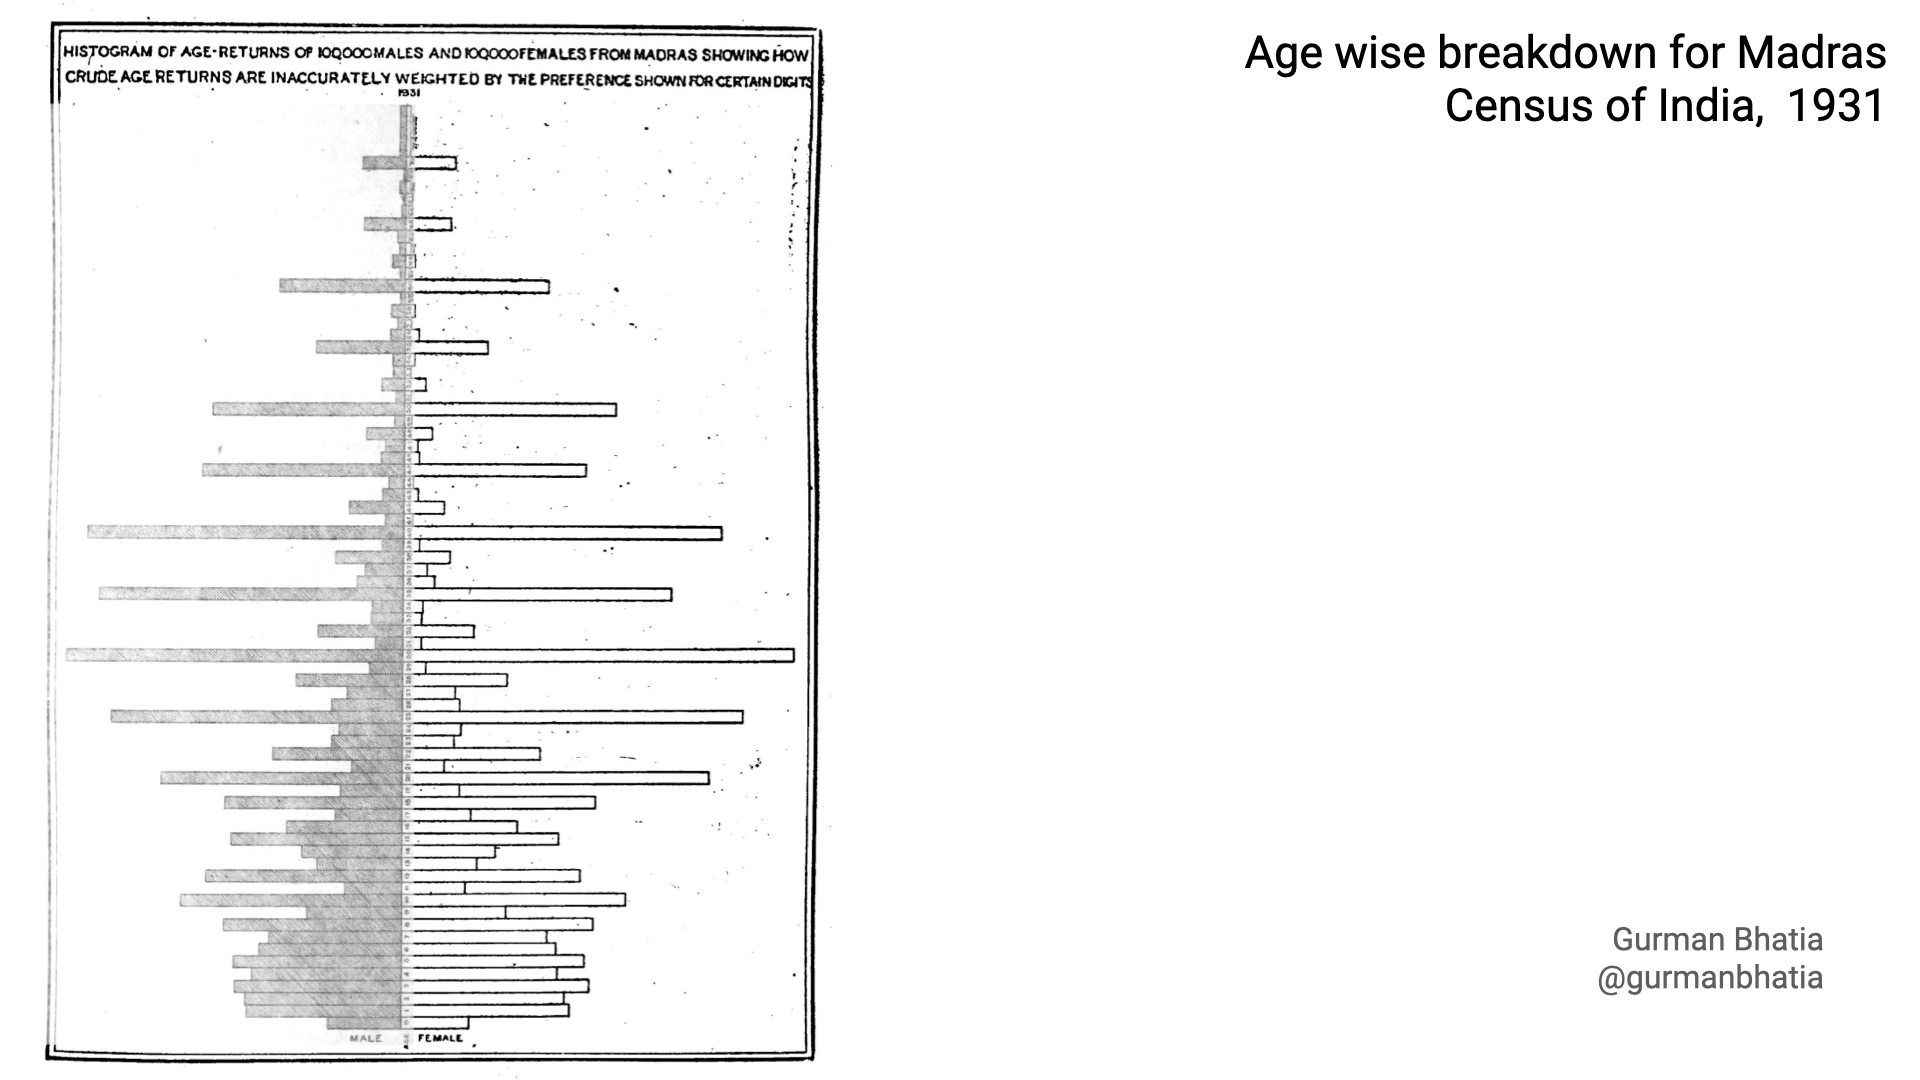 To understand why something like that happens, one has to understand how the data was collected.
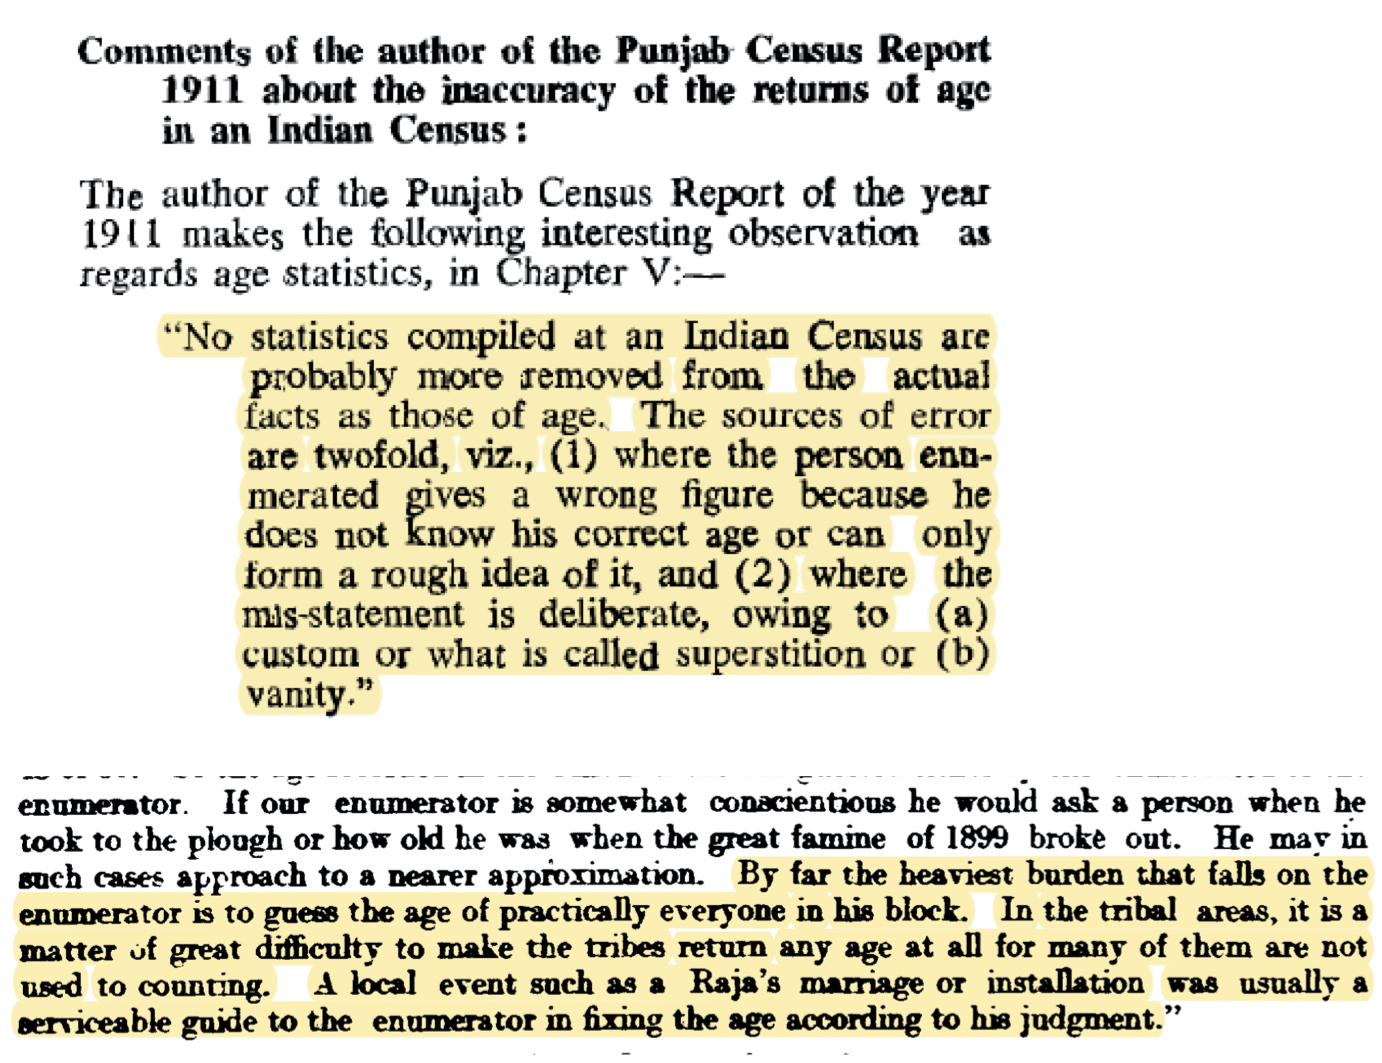
 And the census books talk about this too…
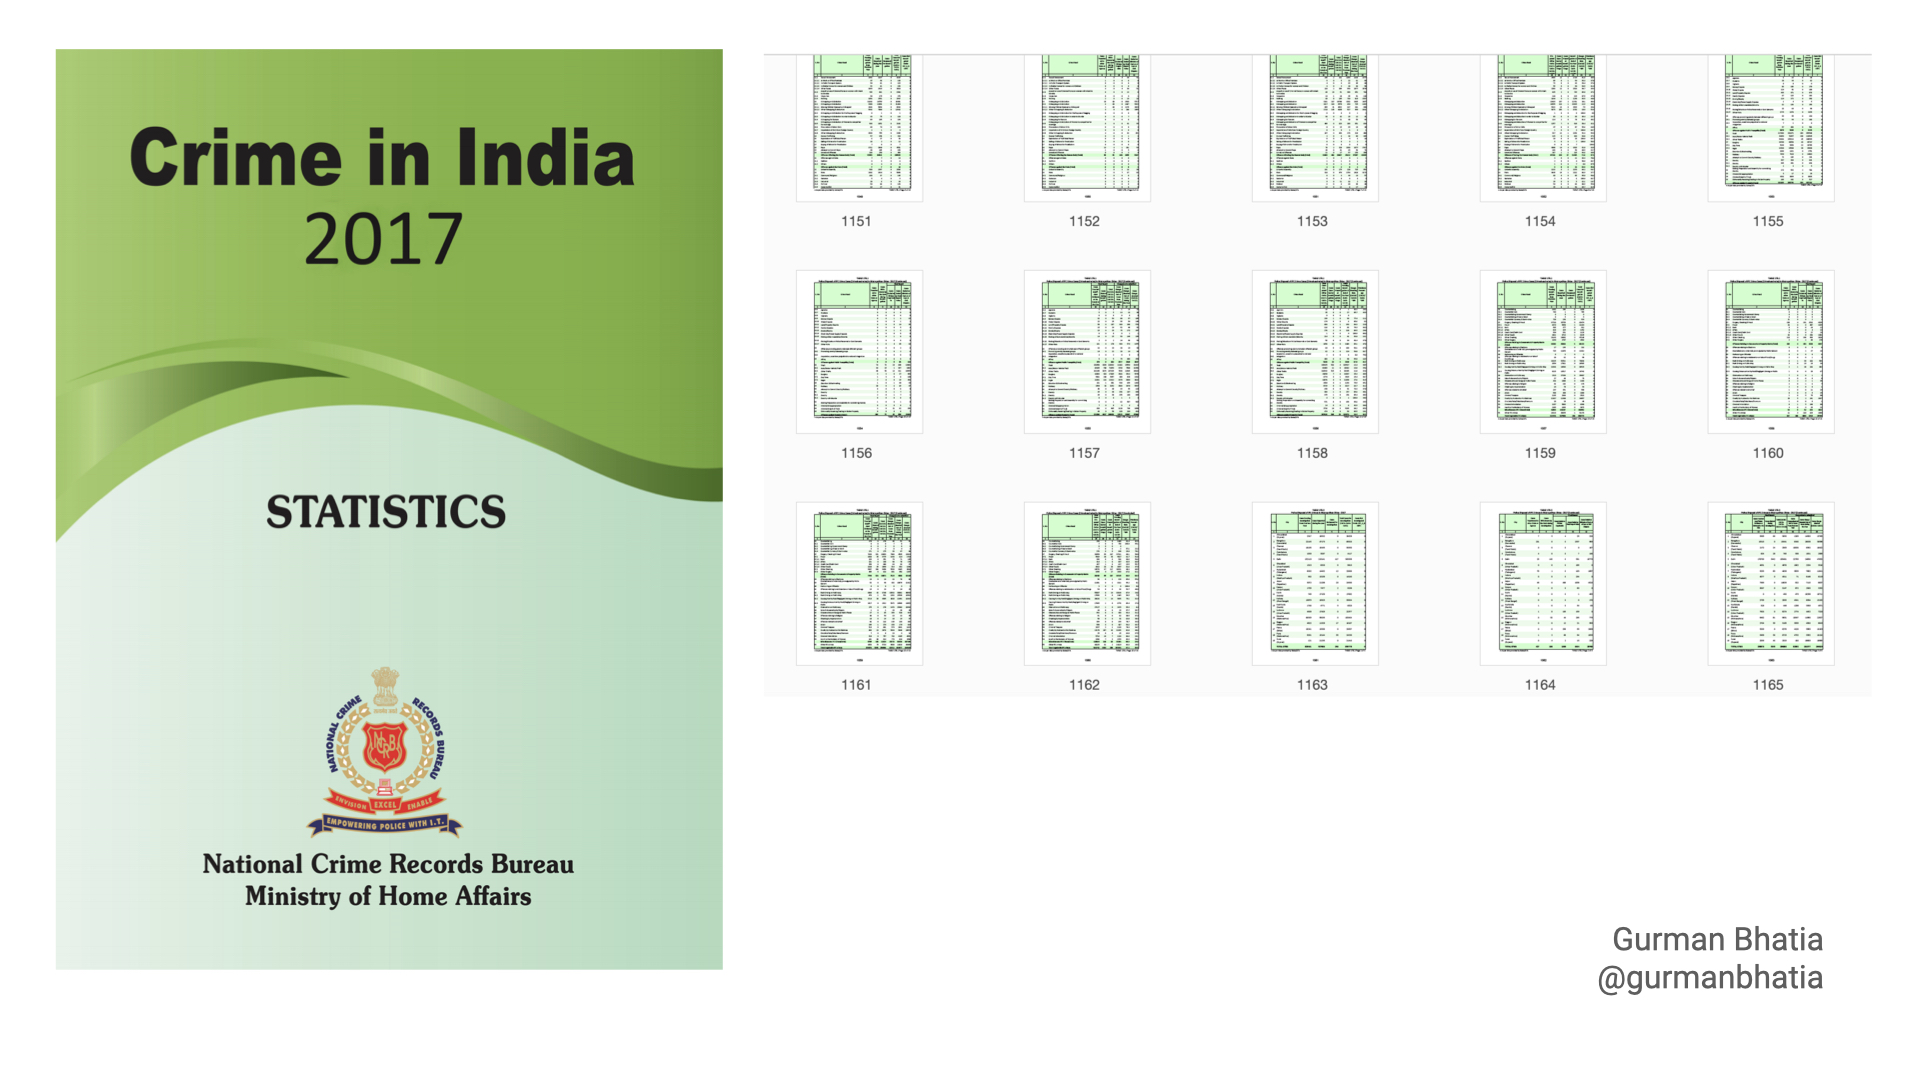
Dataset No. 2: Crime records
The Indian crime data is released in the NCRB Crime in India booklet every year. There are no excel sheets. All we get is a pdf with hundreds of pages.
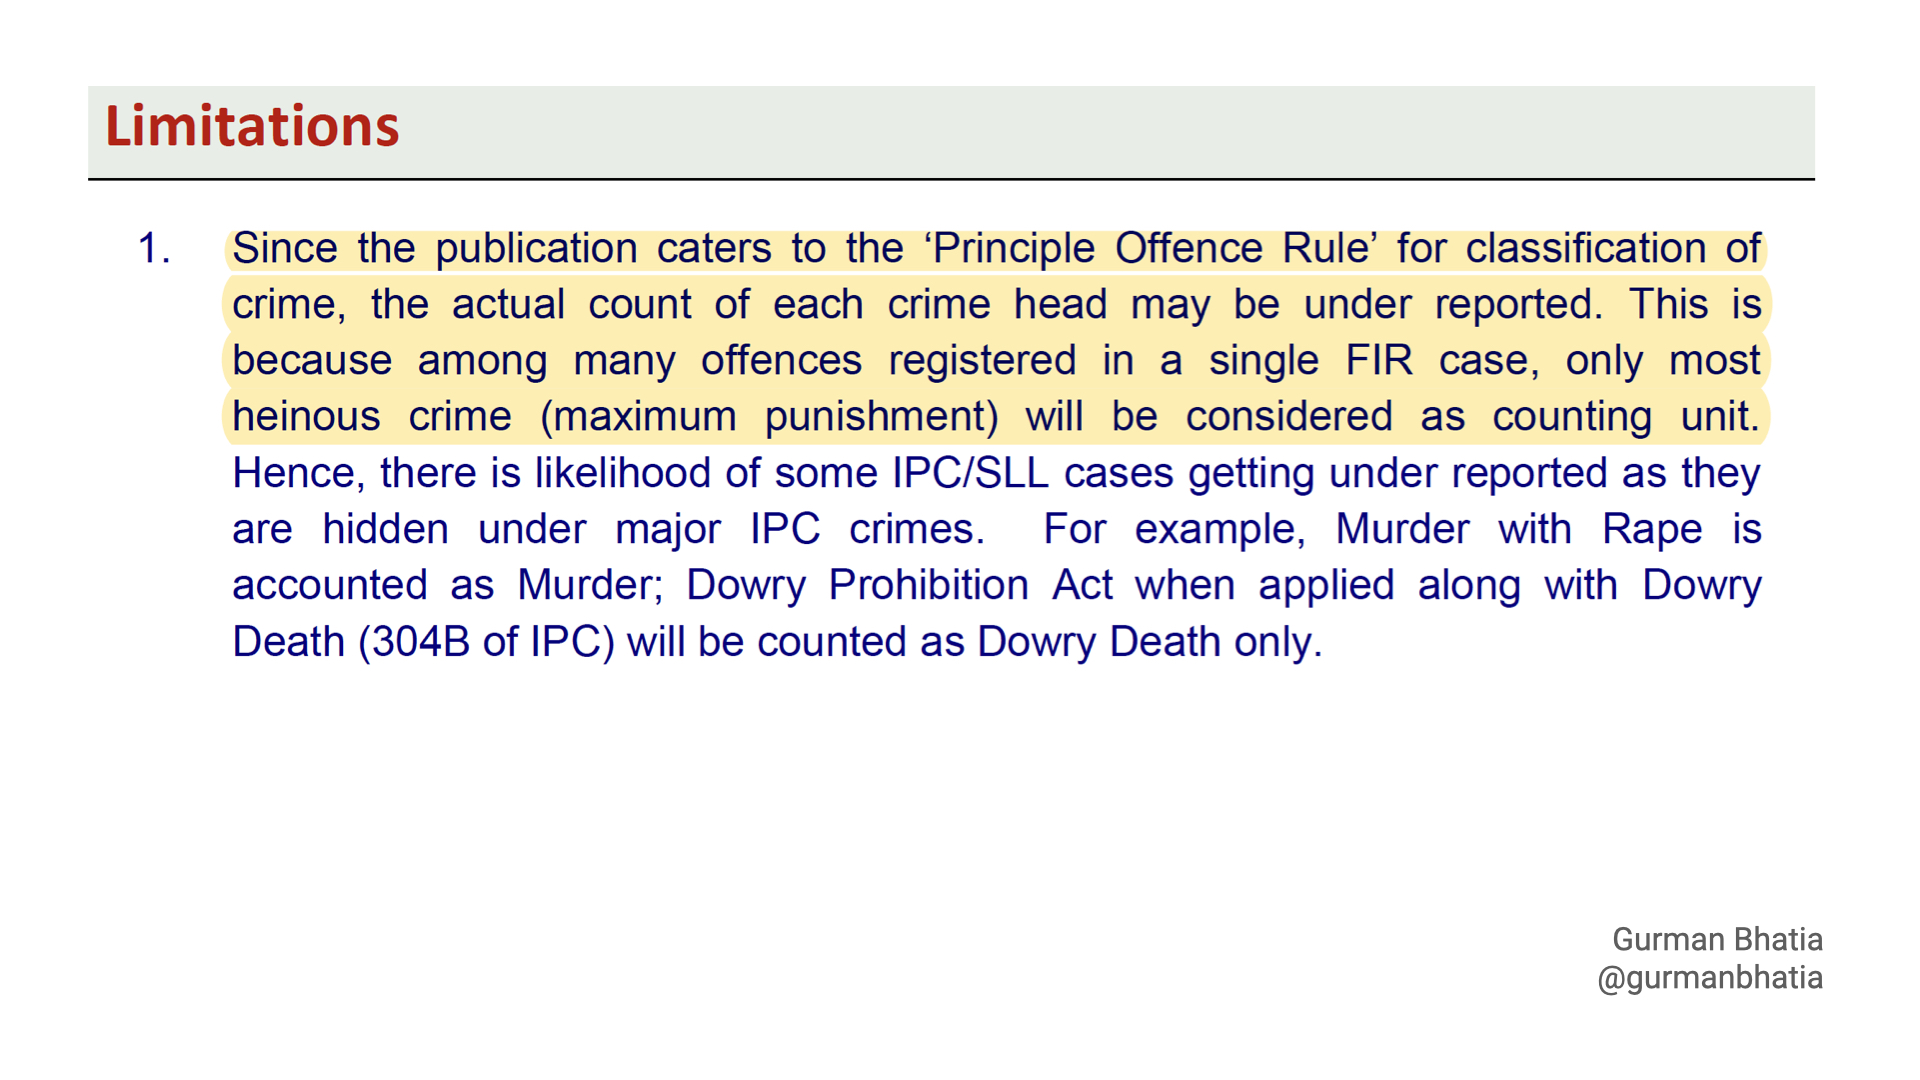
 However, the way numbers are counted is flawed.
 The name of the problem - “Principle offence rule”. Under this rule, the more severe charge takes the statistic number. For example, if there is a rape where the victim is murdered, the crime is considered a murder and not a rape.
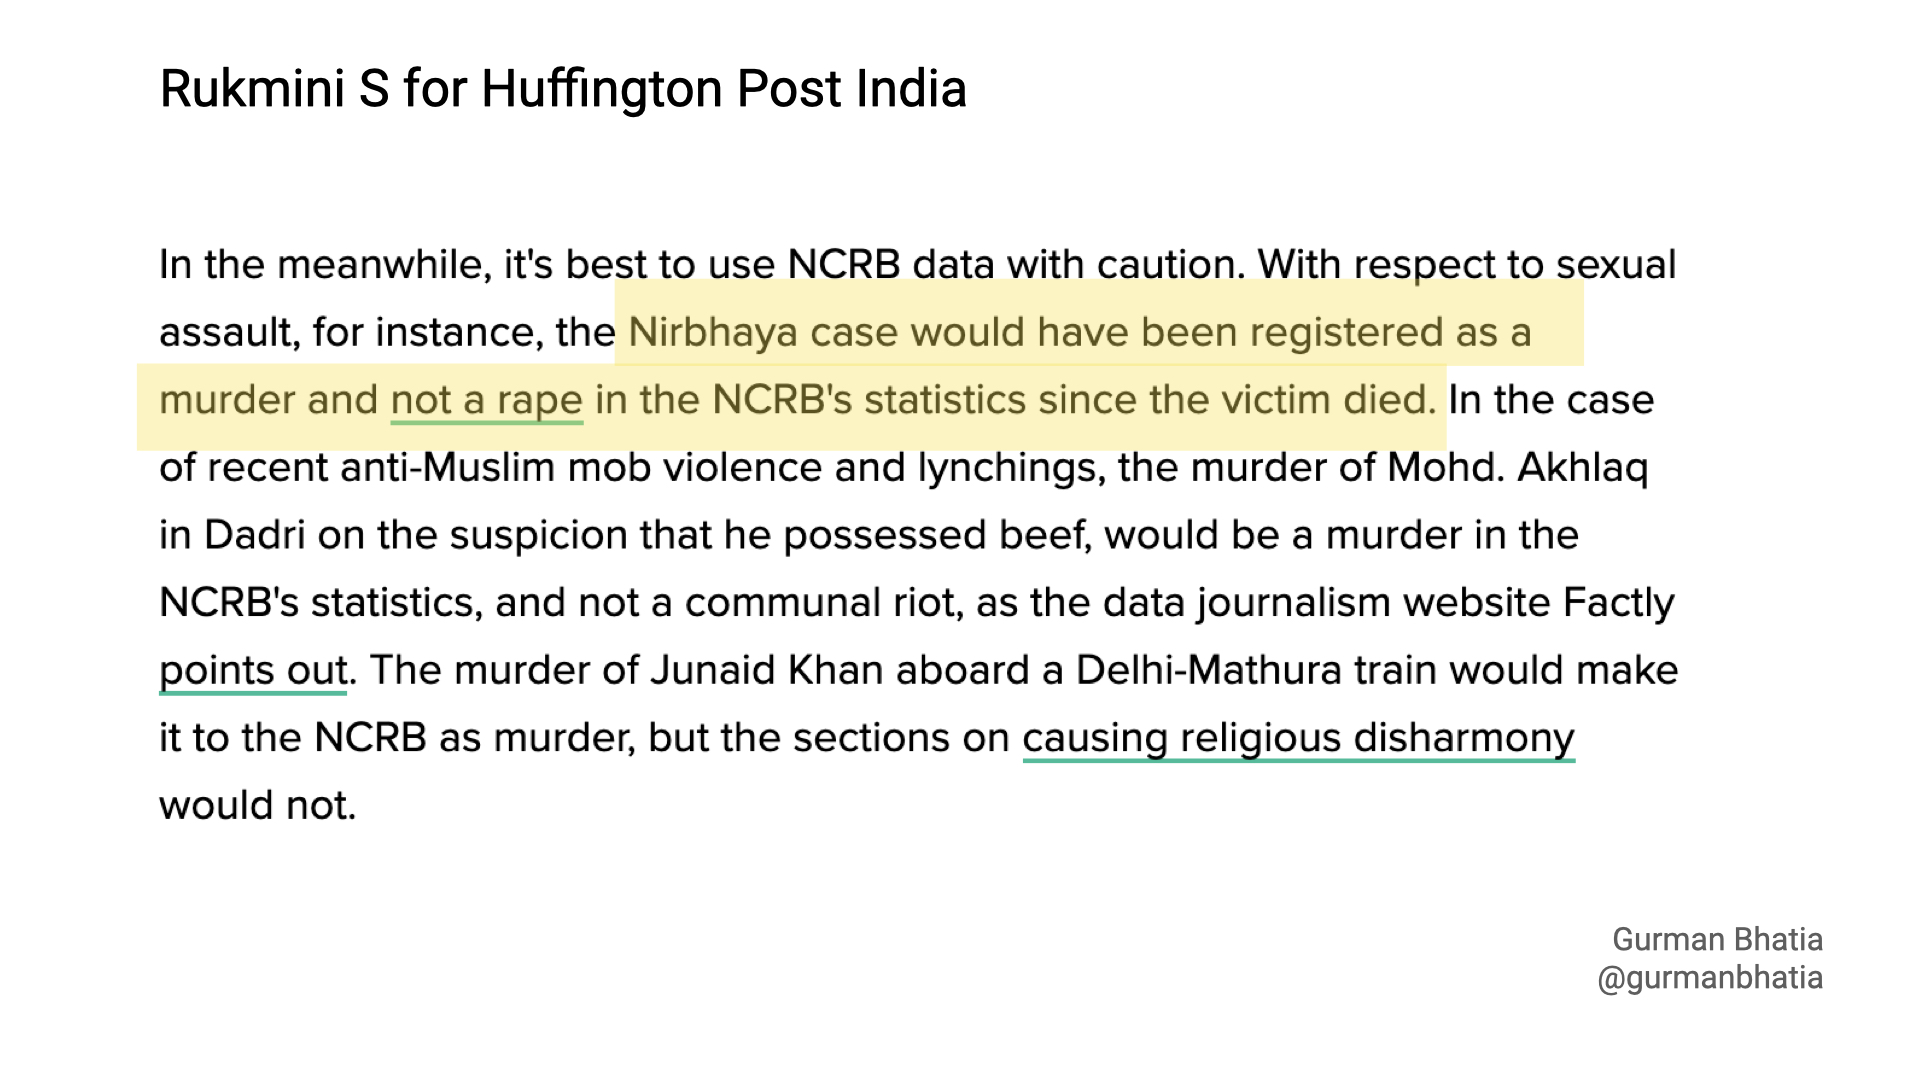 The fact is, we lose something as soon as information becomes a data point.

Dataset No. 3: Elections!
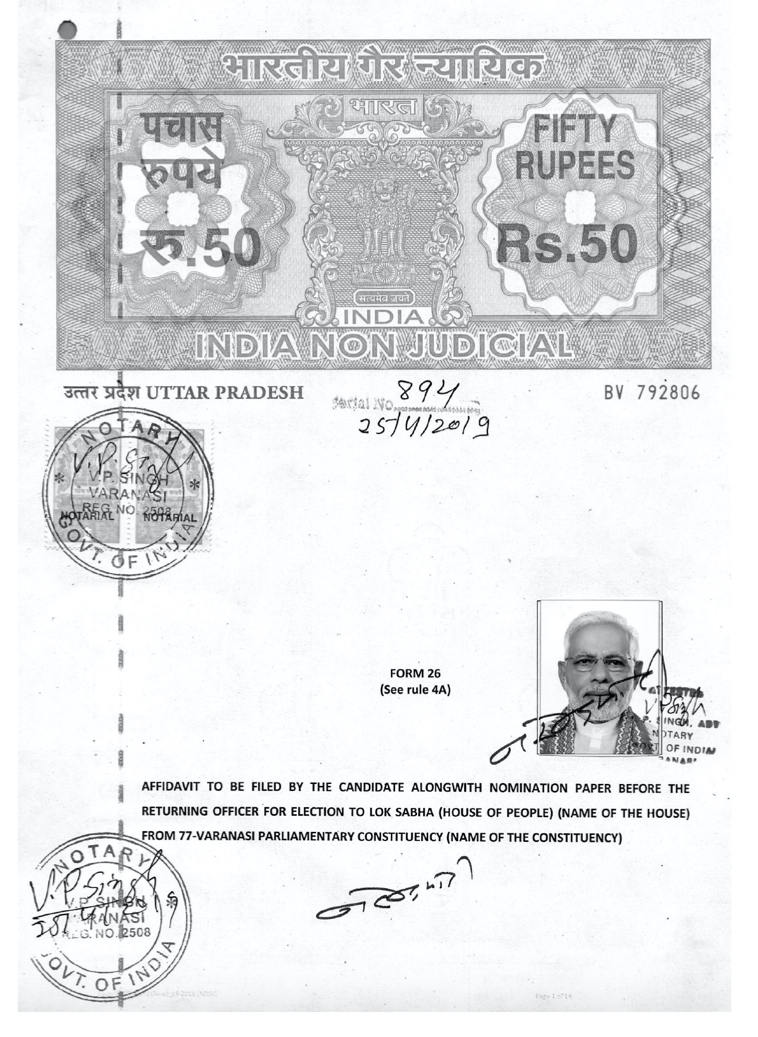
Before any election in India, candidates have to submit affidavits where they declare their assets, education, criminal cases, how much gold they own…
Of course because now we know that we need to understand the collection process, we will remember the caveat that they are declaring these things.
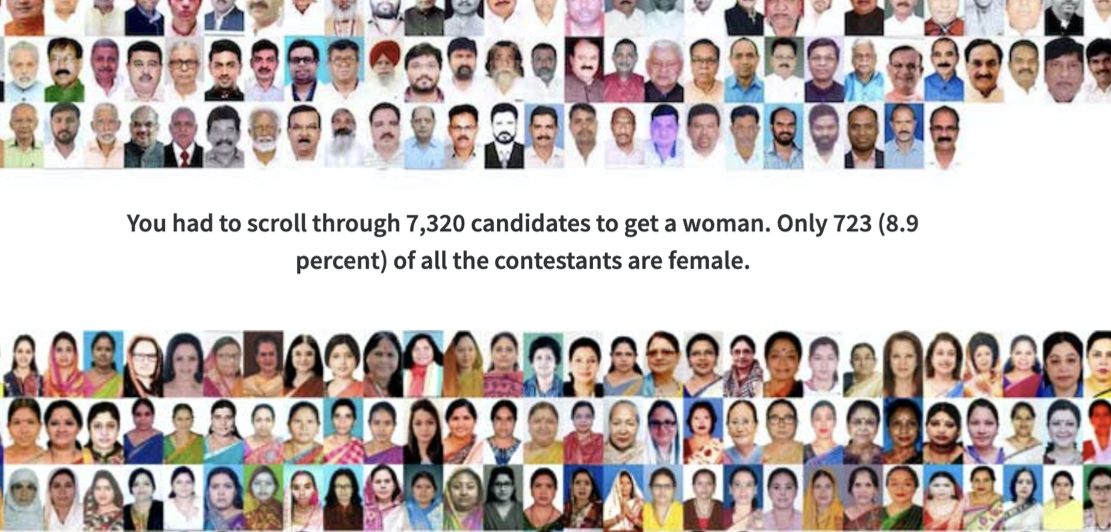
This year we also had photos of candidates on the ballot. The photos were introduced by the Election Commission to deal with dummy independent candidates that run in the election to confuse voters. That means, sometimes five Gurpreet Singhs will contest from Zira in Punjab. So in addition to the information, we got the photos of all candidates on the official government site.
 So we used them in a project for which I made this long scroll thing.
And also added faces to a regular treemap about wealth and criminal cases


 The photos were a good design decision because it creates empathy and is so much more human.
Technology, machines, histograms and scatter plots are important.
But people are most important.
Because people don’t remember numbers, people remember people.
What took time in the project was not the design, but the data vetting. Firstly, matching people that have their name spelt in different names in different datasets was a pain. I had to absolutely make sure we put the right face in the right box.
Despite all that, 4 hrs away from publishing, and we notice two Rahul Gandhi’s on our treemap.
 This had happened because some candidates run from two seats during these elections. Because the treemap showed what proportion of the wealth comes from which candidate, the duplicates had to be removed but there was no absolute method to identify them. So we held the publishing for few more hours and weeded the duplicates out.
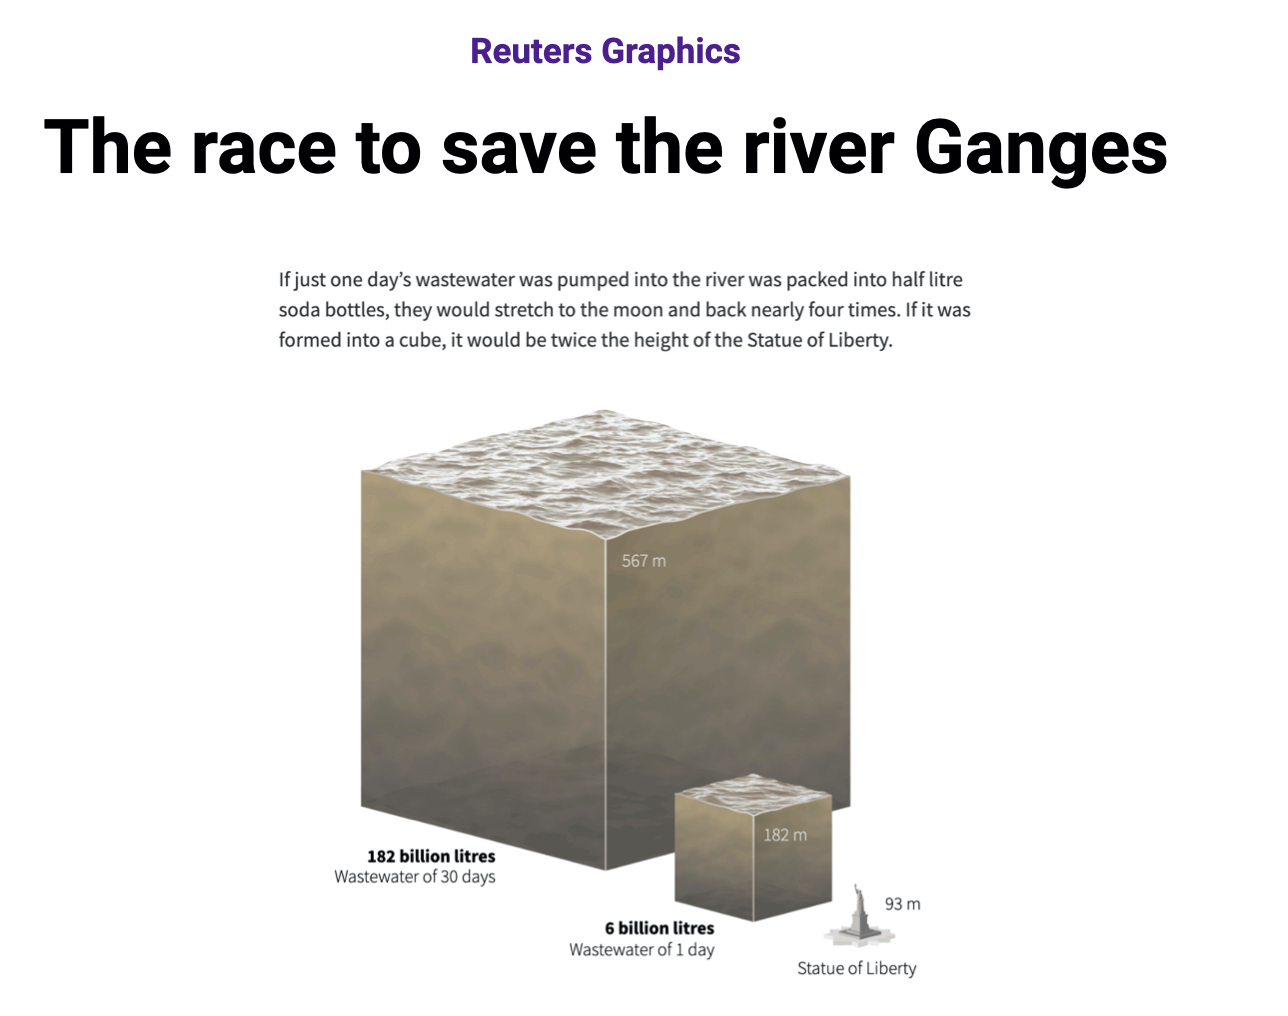
Dataset No. 4: Air quality
Before I talk about air pollution, I want to a share a small conversation I had with my 9-year-old niece about about the subject last week. We have these weekly calls because she is a curious kid and I am journalist in search of good questions. So we both have self serving conversations that meet our brain’s needs. On one our call last weekend, she is like…
Niece: I heard that the pollution in Delhi has improved.
Me: Improved in what sense? Improved over the years, or improved when compared to last week?
Niece: I am not sure, I heard about it on the echo… So why does this thing happen during this season? Is it because of the festival? Because people burn crackers on Diwali?
Me: It is one of the many reasons - vehicles, industry, activities like garbage burning and crop burning - all are part of it.
And as I told to her about it, I show her a map from a story I published 2 days before this conversation.
 Niece: Omg! Is that red thing India?
Me: Yes.
Niece: Which place has the least amount of pollution?
Me: I don’t know… maybe Scandinavia.
Niece: What about Australia? What about America?
In a couple of minutes she is making comparisons.
And with all the comparisons, she is illustration the important of context.
Think about Joe in New York.
And about Diljeet in Amritsar.
Back to the quote…
“Finding the right numbers requires as much specialised skill - statistical skill - and hard work as creating a beautiful design or covering a complex news story.”
— Edward Tufte
I think, that statistical skills is also a journalistic skill. Cause journalists need to be good researchers.
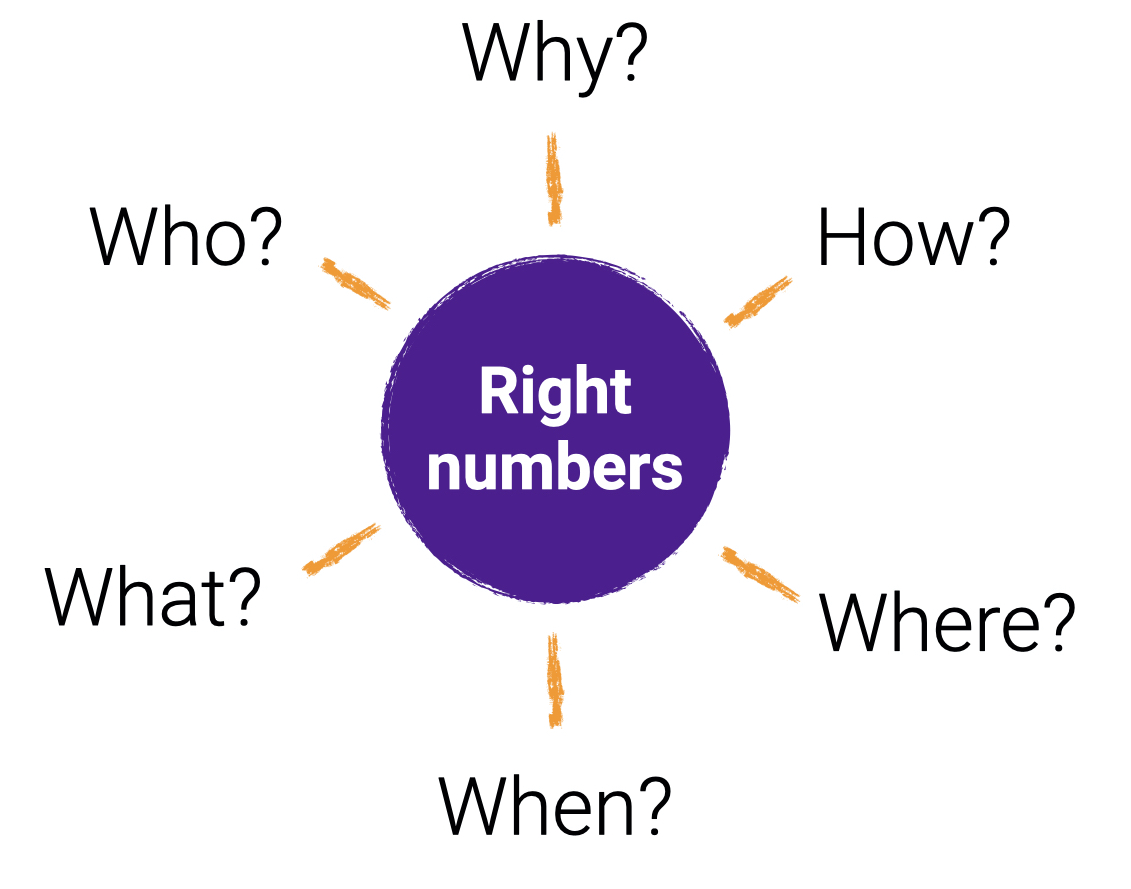
These are the basic questions we’re repeatedly asked to pose in journalism.
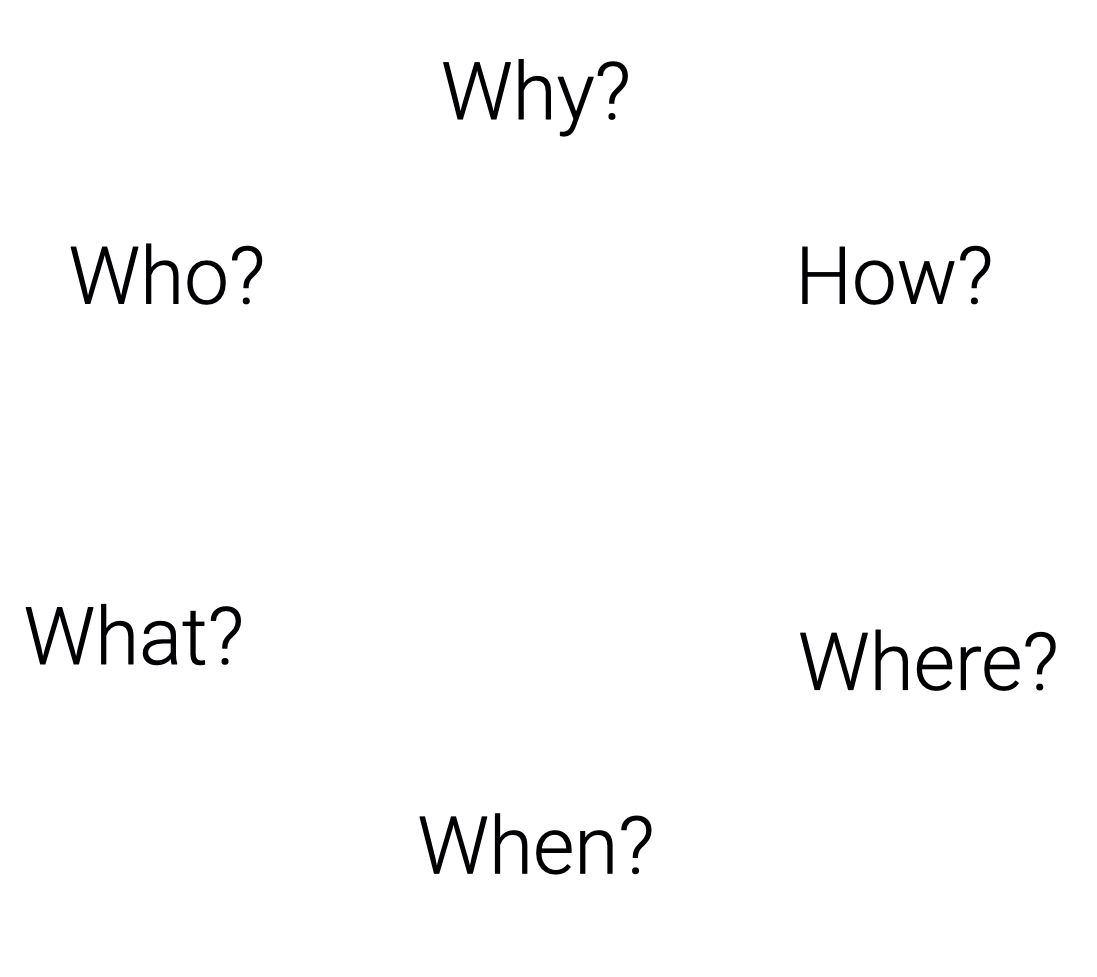
These are also the questions that lead us to the right numbers.
Who collected it? How did they do it? Why did they do it? What does my data leave out? When is this data from? What impact does it make?
To recap, some traits of the “right numbers”
- You understand how they were collected
- You understand the cultural context
- Include more than they exclude
- Are ethically fair and honest
- Have contextual comparisons for the audience
Question the data and interview it. That process of thinking like a journalist, will hone your stories. And good stories hone your design.