Picture perfect dataviz
20 minutes packed with examples that use photographs as a dataviz tool. A combination of philosophy and practical frameworks. Originally delivered virtually at Outlier 2022 in April 2022.
Frameworks
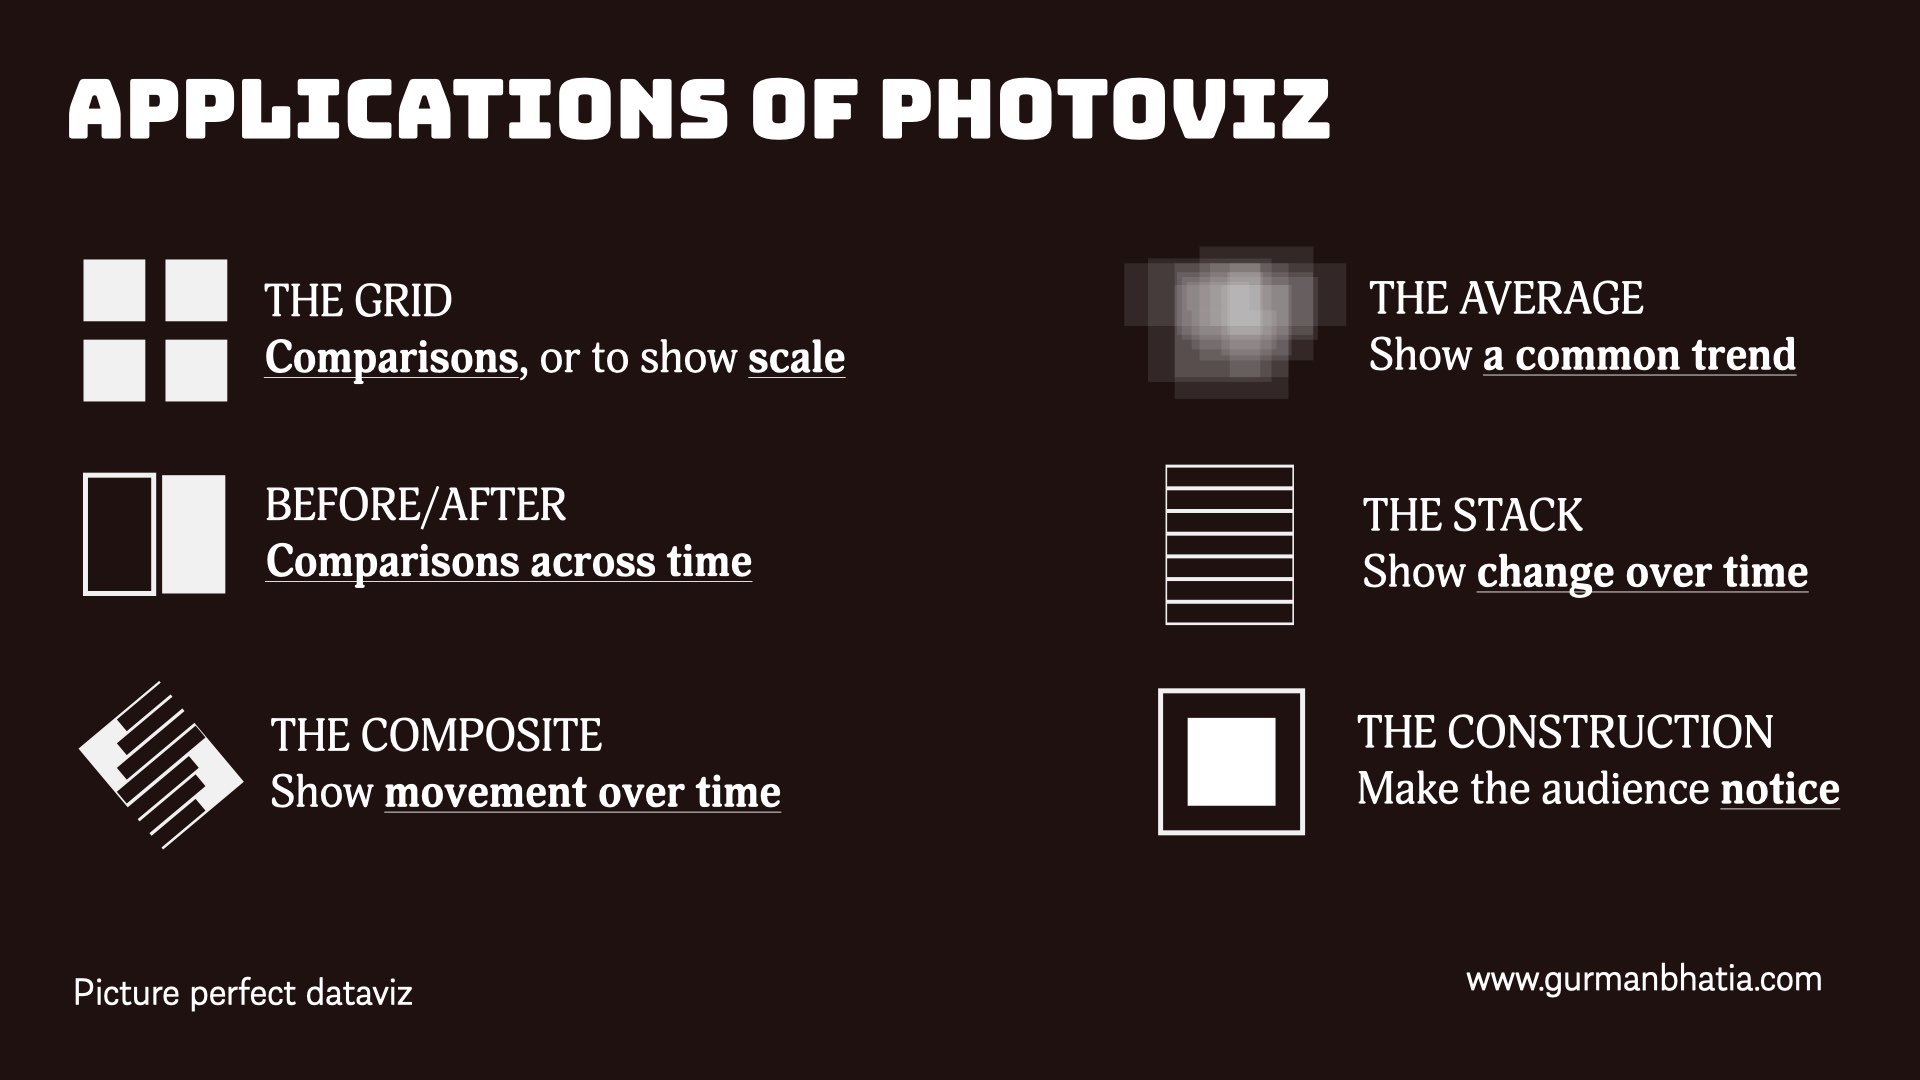
The grid - for comparisons or to show scale
- A window to Delhi’s pollution / Reuters Graphics
- Dollar Street / Gapminder
- Figures behind the faces / Reuters Graphics
- Heroin: Killer of a generation / The Palm Beach Post
Before and after - For comparisons across time
- Dixie Fire / Maxar Technologies
The composite - To show movement over time
- Movements in Pole Vaulting (1884) / Étienne-Jules Marey
- Pole Vault (1885) / Thomas Eakins via Charles Bregler’s Thomas Eakins Collection
- Pole Vault (1964) / Harold Edgerton
- Frame by Frame, Moves That Made Simone Biles Unbeatable / The New York Times
The stack - To show change over time
- Time in Motion / Fong Qi Wei
- Face of a nation / Güney Soykan
- The Sunday Times 2013 Rich List / Grey London
- What tree rings reveal about America’s megadrought / Alvin Chang for The Guardian
The average - To show a common trend
- The average Indian PM / Pixa Naut
- The average American athelete / Brandon Liu
- Tens days on Tinder / Pierre Buttin
The construction - To make the audience notice
- A plateful of plastic / Reuters Graphics
- These vehicles are carrying 69 people (1965) / Heinz Zinram for London Transport
- Trash or treasure: Can you tell what can and cannot be recycled? / The Straits Times
- Books read v/s bought / Kirti Vardhan
Books
- Photoviz / Nicholas Feltron
- On Photography / Susan Sontag
- Stopping Time: The Photographs of Harold Edgerton